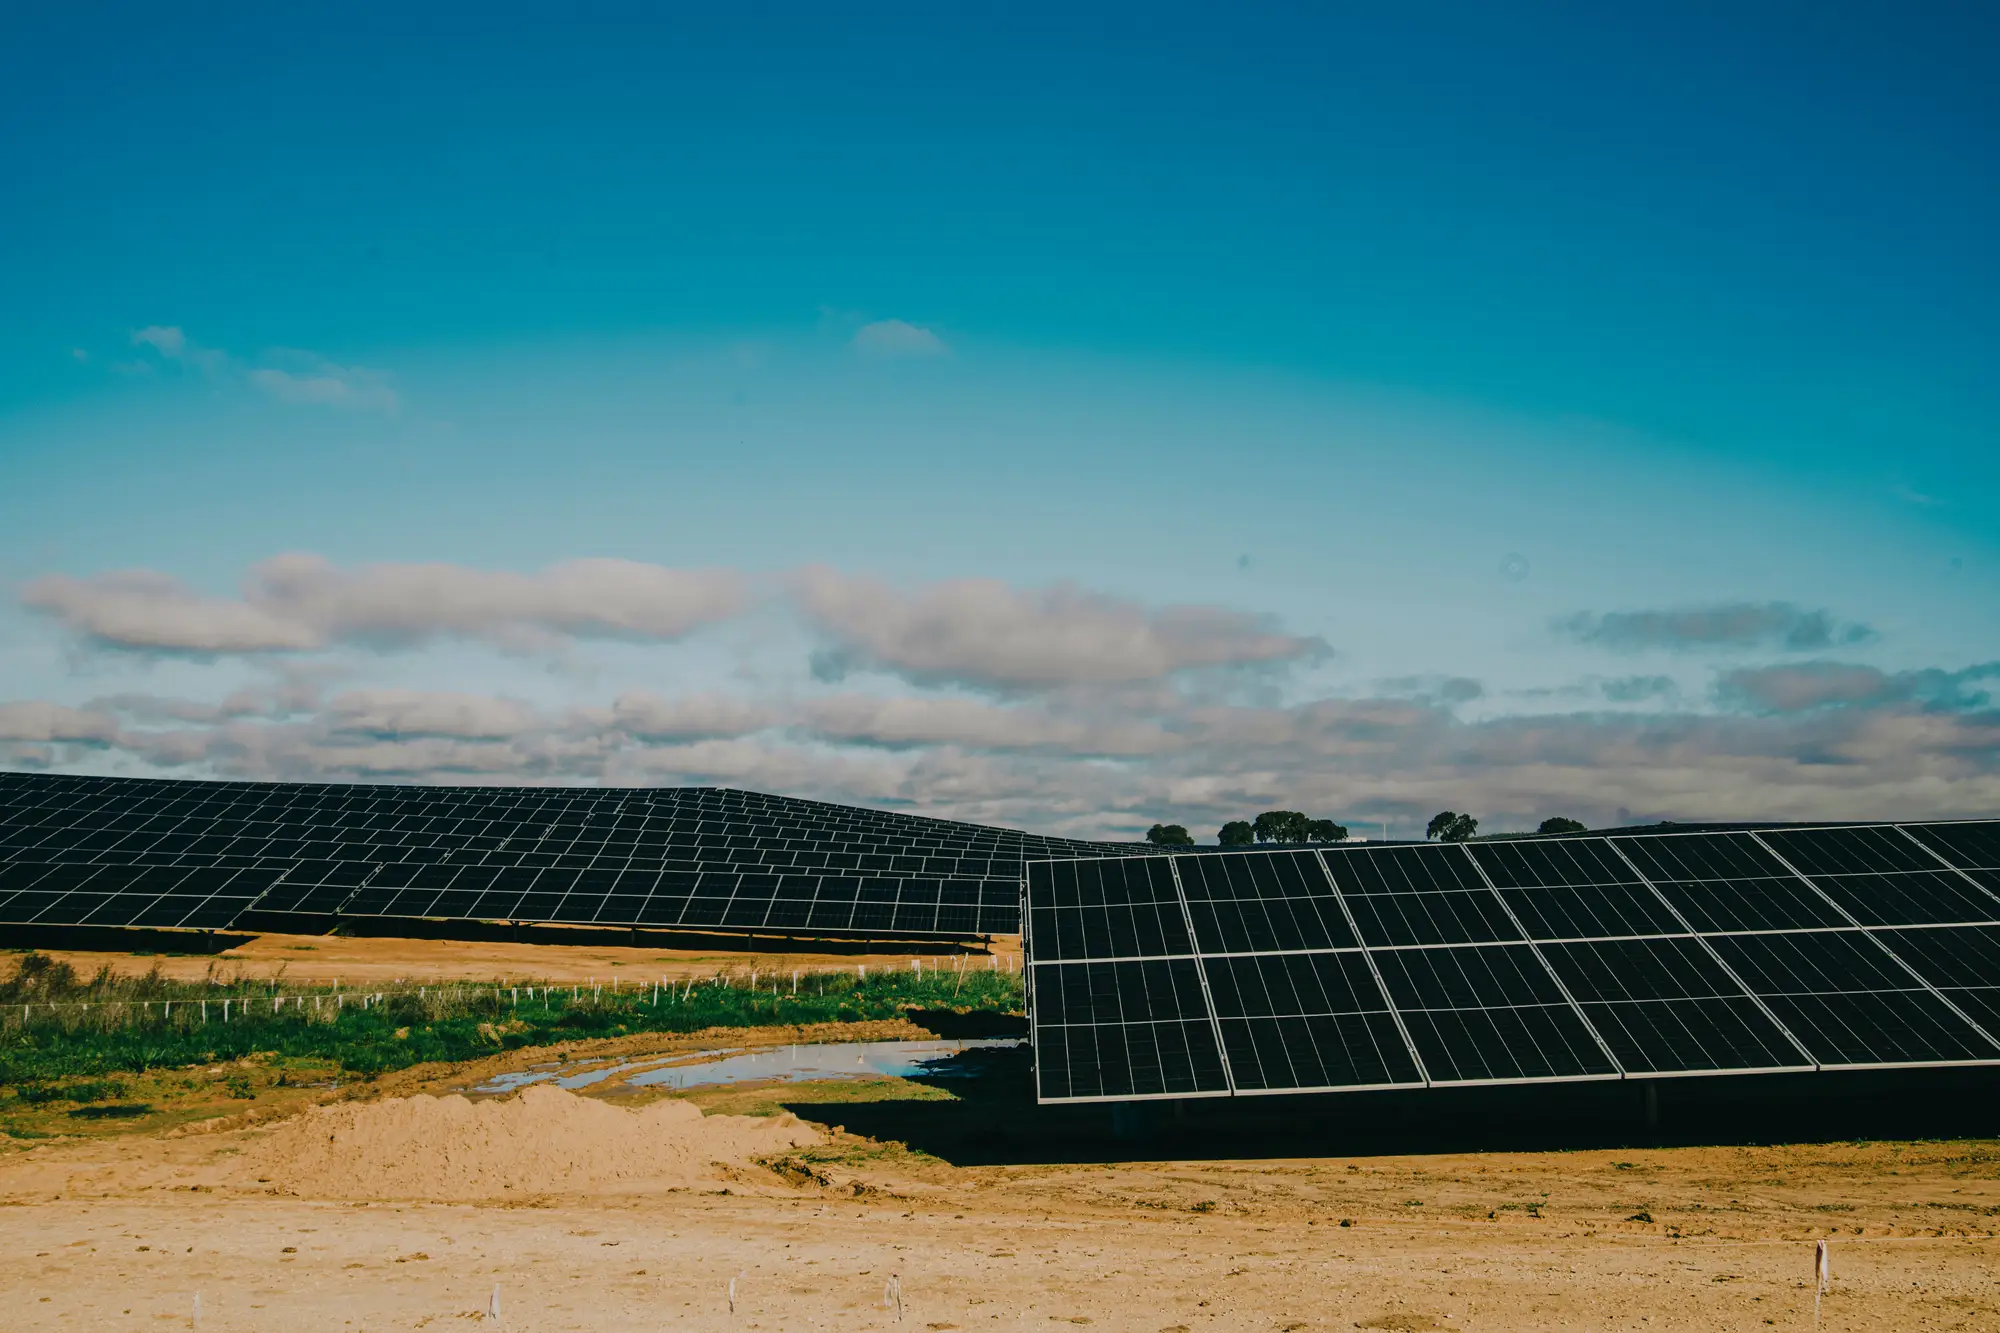
Hot-cell findings
Thermal anomalies flagged per table, each tied to a table reference and an annotated image. Replaces the notes sheet from the walk. One delivery per annual flyover.
One RGB and thermal flyover of the array each year, returned as a findings dossier: hot cells, suspected string outages and soiling by table, ready to turn into tickets.
Someone on your crew walks the rows with a thermal camera, table by table, while the array is loaded and the sun is up. On a big site that takes long enough that the cleaning plan is drawn before the walk is done.
Hot cells go on a sheet by table and row. A dead string tends to show up another way, when the inverter reads low and a technician goes looking. Soiling gets judged from the ground by eye, so the cleaning cycle follows the calendar.
| Step | The handheld walk | With Panel Soiling |
|---|---|---|
| Row 01Covering the array | A technician walks every row with a handheld thermal camera, over as many loaded days as the site needs. | One paired RGB and thermal flyover over the site boundary you send. |
| Row 02Finding hot cells | You spot them on the camera screen and note the table and row by hand. | Thermal anomalies come back flagged per table in a findings list, each with an annotated image. |
| Row 03Finding string outages | The inverter or combiner box reads low, then someone goes to find the string. | Suspected outages are flagged from their thermal signature across the array, so they land in the same list as the hot cells. |
| Row 04Deciding what to wash | The cleaning cycle follows the calendar, with soiling judged by eye from the ground. | Tables are ranked by apparent soiling loss, so the crew starts with the dirtiest. |
| Still yours: How often to wash, what it costs, and whether a table is worth the visit. | ||
| Row 05Writing the tickets | Findings are typed into the O&M system one at a time from notes. | A CSV with one row per finding, keyed to your table references, plus overlay images to attach. |
| Row 06Confirming a finding | You are standing at the table when you decide what it is. | You still stand there, but you go to the flagged tables first. |
| Still yours: Field confirmation, IV-curve tracing, and the repair itself. | ||
Thermal anomalies flagged per table, each tied to a table reference and an annotated image. Replaces the notes sheet from the walk. One delivery per annual flyover.
Strings that look out of service from their thermal signature, listed with the table references involved. They sit in the same list as the hot cells, so one ticket run covers both.
Tables ordered by apparent soiling loss. Soiling and hot cells are separate finding types, since they look different in the thermal image. Read it ahead of the cleaning-cycle plan.
The whole dossier as a CSV you can load into your ticket system or a spreadsheet, with the annotated overlay images alongside.
You send the site boundary and your table and row numbering, so findings come back in the references your crews use.
We agree a capture window with you. Thermal needs loaded modules in steady sun, so the date is scoped around your weather, not ours.
RGB and thermal are captured together in one pass over the whole array.
Anomalies and soiling patterns are flagged and ranked, and the dossier is delivered before you book cleaning and string-repair crews.
Thermal capture is sensitive to the time of day and to how hard the sun is working the modules. Capture is timed with you and can be pushed by weather.
At 3 cm a pixel, a standard cell spans several pixels. That is enough to see a hot cell and not enough to see a cracked cell, a bad solder joint or anything smaller than a cell.
Soiling is read from the image. It is not a measurement of lost kilowatt-hours, and the ranking says which tables look dirtiest, not what the dirt cost you.
Flagged strings are suspected outages. A person still checks them, and IV-curve tracing stays the way to diagnose a string.
One flyover a year. A cell that overheats after the pass shows up in next year's, and soiling that builds after it is not tracked.
The dossier is a screening list. It is not a signed thermography report for a warranty or insurance claim.
No. The findings are thermal and visual signatures. Metered output and loss figures come from your own monitoring.
They come back as separate finding types because they look different in the thermal image. Confirm in the field before a crew acts on either.
No. It is a screening pass that says where to send the person with the tracer or the hose.
When the array is loaded and the light is steady. We scope the capture window with you, and weather can move it.
Yes. Both the RGB and the thermal pass need stable conditions, so a patchy day gets rescheduled.
Pick a block your crew walked recently and don't send us the notes. Compare the tables we flag with yours, then decide whether the ranking is good enough to book crews from.
The findings come as a CSV keyed to your table references, plus images. We don't write into your system directly.
Ownership and licence terms are agreed in writing before the flyover. If your legal team needs to review them, ask early.
The quote depends on site size and the platform used for the flyover. We scope it for your site and don't give a number before that.
Tell us the site size and when the cleaning plan is due. We will say whether a capture window fits.
Get started